Southern California import volumes have looked weak in year-over-year comparisons, but the bigger story is normalization after five years of disruption. Inland point intermodal (IPI) shareis easing from early-2025 highs, while transload dynamics reflect capacity constraints and seasonal shifts. A gradual reopening of theRed Sea/Suez route could further rebalance “jump ball” freight toward the East Coast.
What the YoY Declines Are Really Signaling
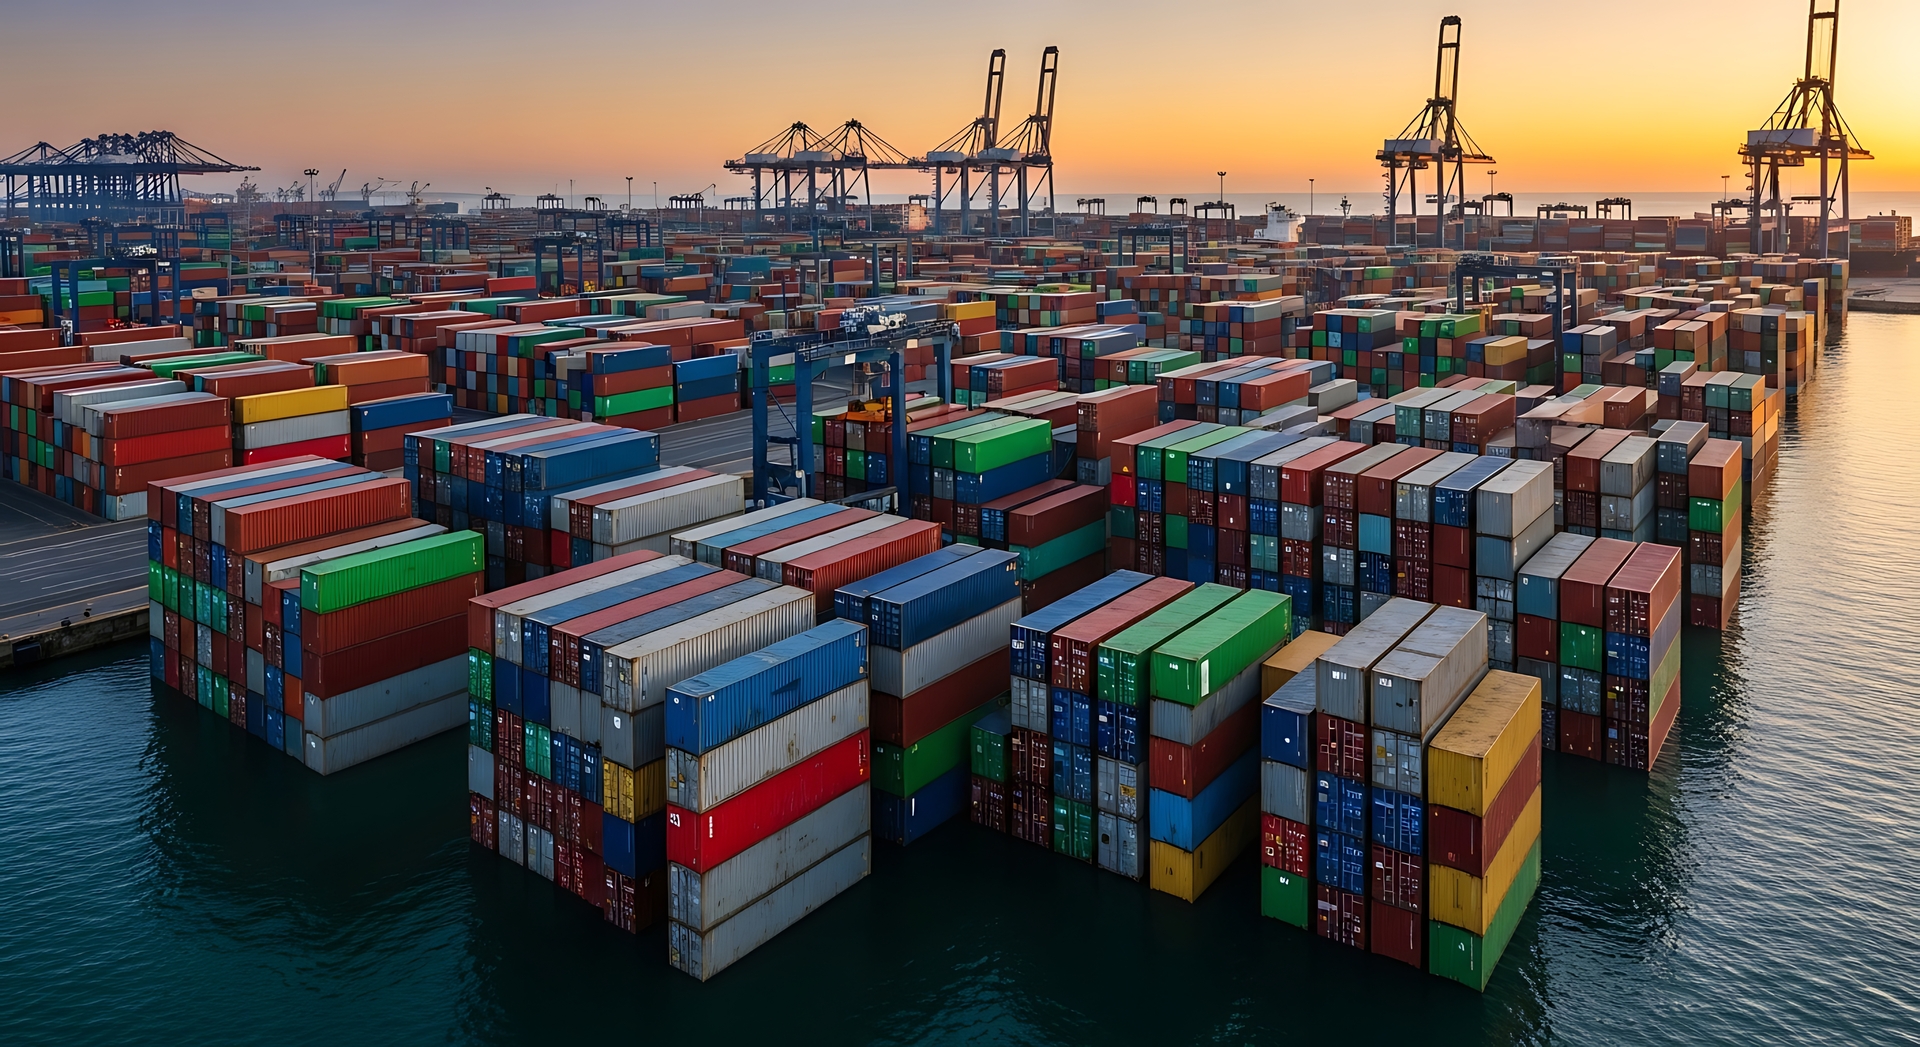
Southern California import TEUs have come in below the prior year in six of the last seven months—an easy headline to misread as demand deterioration. The underlying analysis suggests something different: a “return to trend” after a period defined by outsized swings rather than steady seasonality.
From 2010–2020, California imports rose gradually with aligned trend signals. That changed as the region absorbed pandemic-driven surges, labor instability on both coasts, and uneven US tariff policy—creating pronounced oscillations in rolling averages.
The recent turbulence can be traced to two overlapping forces:
When shippers can choose West Coast or East Coast routings with similar service outcomes, cost/time trade-offs—and network reliability—become decisive. This is where IPI and transload indicators offer clarity.
From Q1 2023 to Q4 2024, import TEUs leaving California via IPIrose from about 445,000 to 817,000—an 84% increase. Over the same period, total quarterly import TEUs arrivingin California grew about 55%, implying that ameaningful share of the import growth was “pulled inland” viarail.
IPI represented roughly 23% of California importsin 2023 and 26% in 2024, peaking in Q1 2025at over 28% before sliding to about 25.3% in Q42025. This downshift supports the thesis that routing patterns are settling rather than collapsing.
Transload volume grew far less aggressively than IPI over the2023–25 period—about 28% versus IPI’s 84%.Transloads accounted for roughly 47% of import TEUs exiting California in 2023, falling to about 40% by 2025.
Transloading is operationally and commercially complex: adding warehouse capacity, labor, drayage coordination, and customer process changes is materially harder than switching a container’s port of arrival while keeping it intact for inland rail.
Late 2025 shows a familiar seasonal behavior: while IPI volume fell (about 16% from Q3 2025 to year-end), transload volume rose for the second consecutive quarter (just over 4%), consistent with Q4’s emphasis on speed-to-market.
If the Red Sea/Suez route continues to open gradually, East Coast routings may regain cost-and-time competitiveness. That would pushthe economic “dividing line” between West and East Coast gateways westward—potentially reducing Southern California’s share of discretionary “jump ball” freight.
Data Source:https://www.joc.com/article/southern-california-imports-return-to-trend-after-lengthy-period-of-turbulence-6172856


